-
Solo Business Courses
-
 Others
-
Overseas Tutorials
-
Photography & Editing
-
Community & Private Domain
-
Self-Media Writing & Copywriting
-
Side Income Projects
-
E-commerce
-
Short Video & Live Streaming
-
Artificial Intelligence (AI)
-
Software & Tools
-
Operating Systems
-
Plugins & Scripts
-
MacOS Software
-
Android Software
-
Windows Software
LiteMonitor v1.2.7 — Lightweight System Monitoring Tool That Displays CPU, Memory, and Network Usage in Real Time
-
Game Gold-Farming Money-Making Plan: Earn 1k+ Daily, a Stable 3-Year Project Anyone Can Do in Spare Time [Revealed]
Study material — included with membership Get Membership -
Hot-game fully-automated earning: 500+ a day, no experience, simple operation - the steadiest long-term game-earning side hustle (revealed)
Study material — included with membership Get Membership -
FlyingMouse earns merit this time! Don't panic at Windows format problems — the open-source FlyingMouse format conversion tool helps, a popular GitHub gem
Study material — included with membership Get Membership -
Douyin Product-Selling Coaching Bootcamp: No On-Camera Appearance Needed, Newbies Can Produce Selling Short Videos by Following the Steps
Study material — included with membership Get Membership -
First-release game gold-farming money plan: 1K+ a day, ordinary people in spare time
Study material — included with membership Get Membership






-
FlyingMouse earns merit this time! Don't panic at Windows format problems — the open-source FlyingMouse format conversion tool helps, a popular GitHub gem
Study material — included with membership Get Membership -
LuDaShi v6.1024.4105.1121 Slim Single File
Study material — included with membership Get Membership -
2D Cartoon Animation Software Moho Pro v14.3
Study material — included with membership Get Membership -
Video Editor Aiseesoft Filmai v1.0.18
Study material — included with membership Get Membership -
To-Do Microsoft To Do v2.147 Free
Study material — included with membership Get Membership -
PR/AE/DaVinci/FCPX video Plugin Nobe OmniScope Win1.11.15 / Mac1.10.138
Study material — included with membership Get Membership



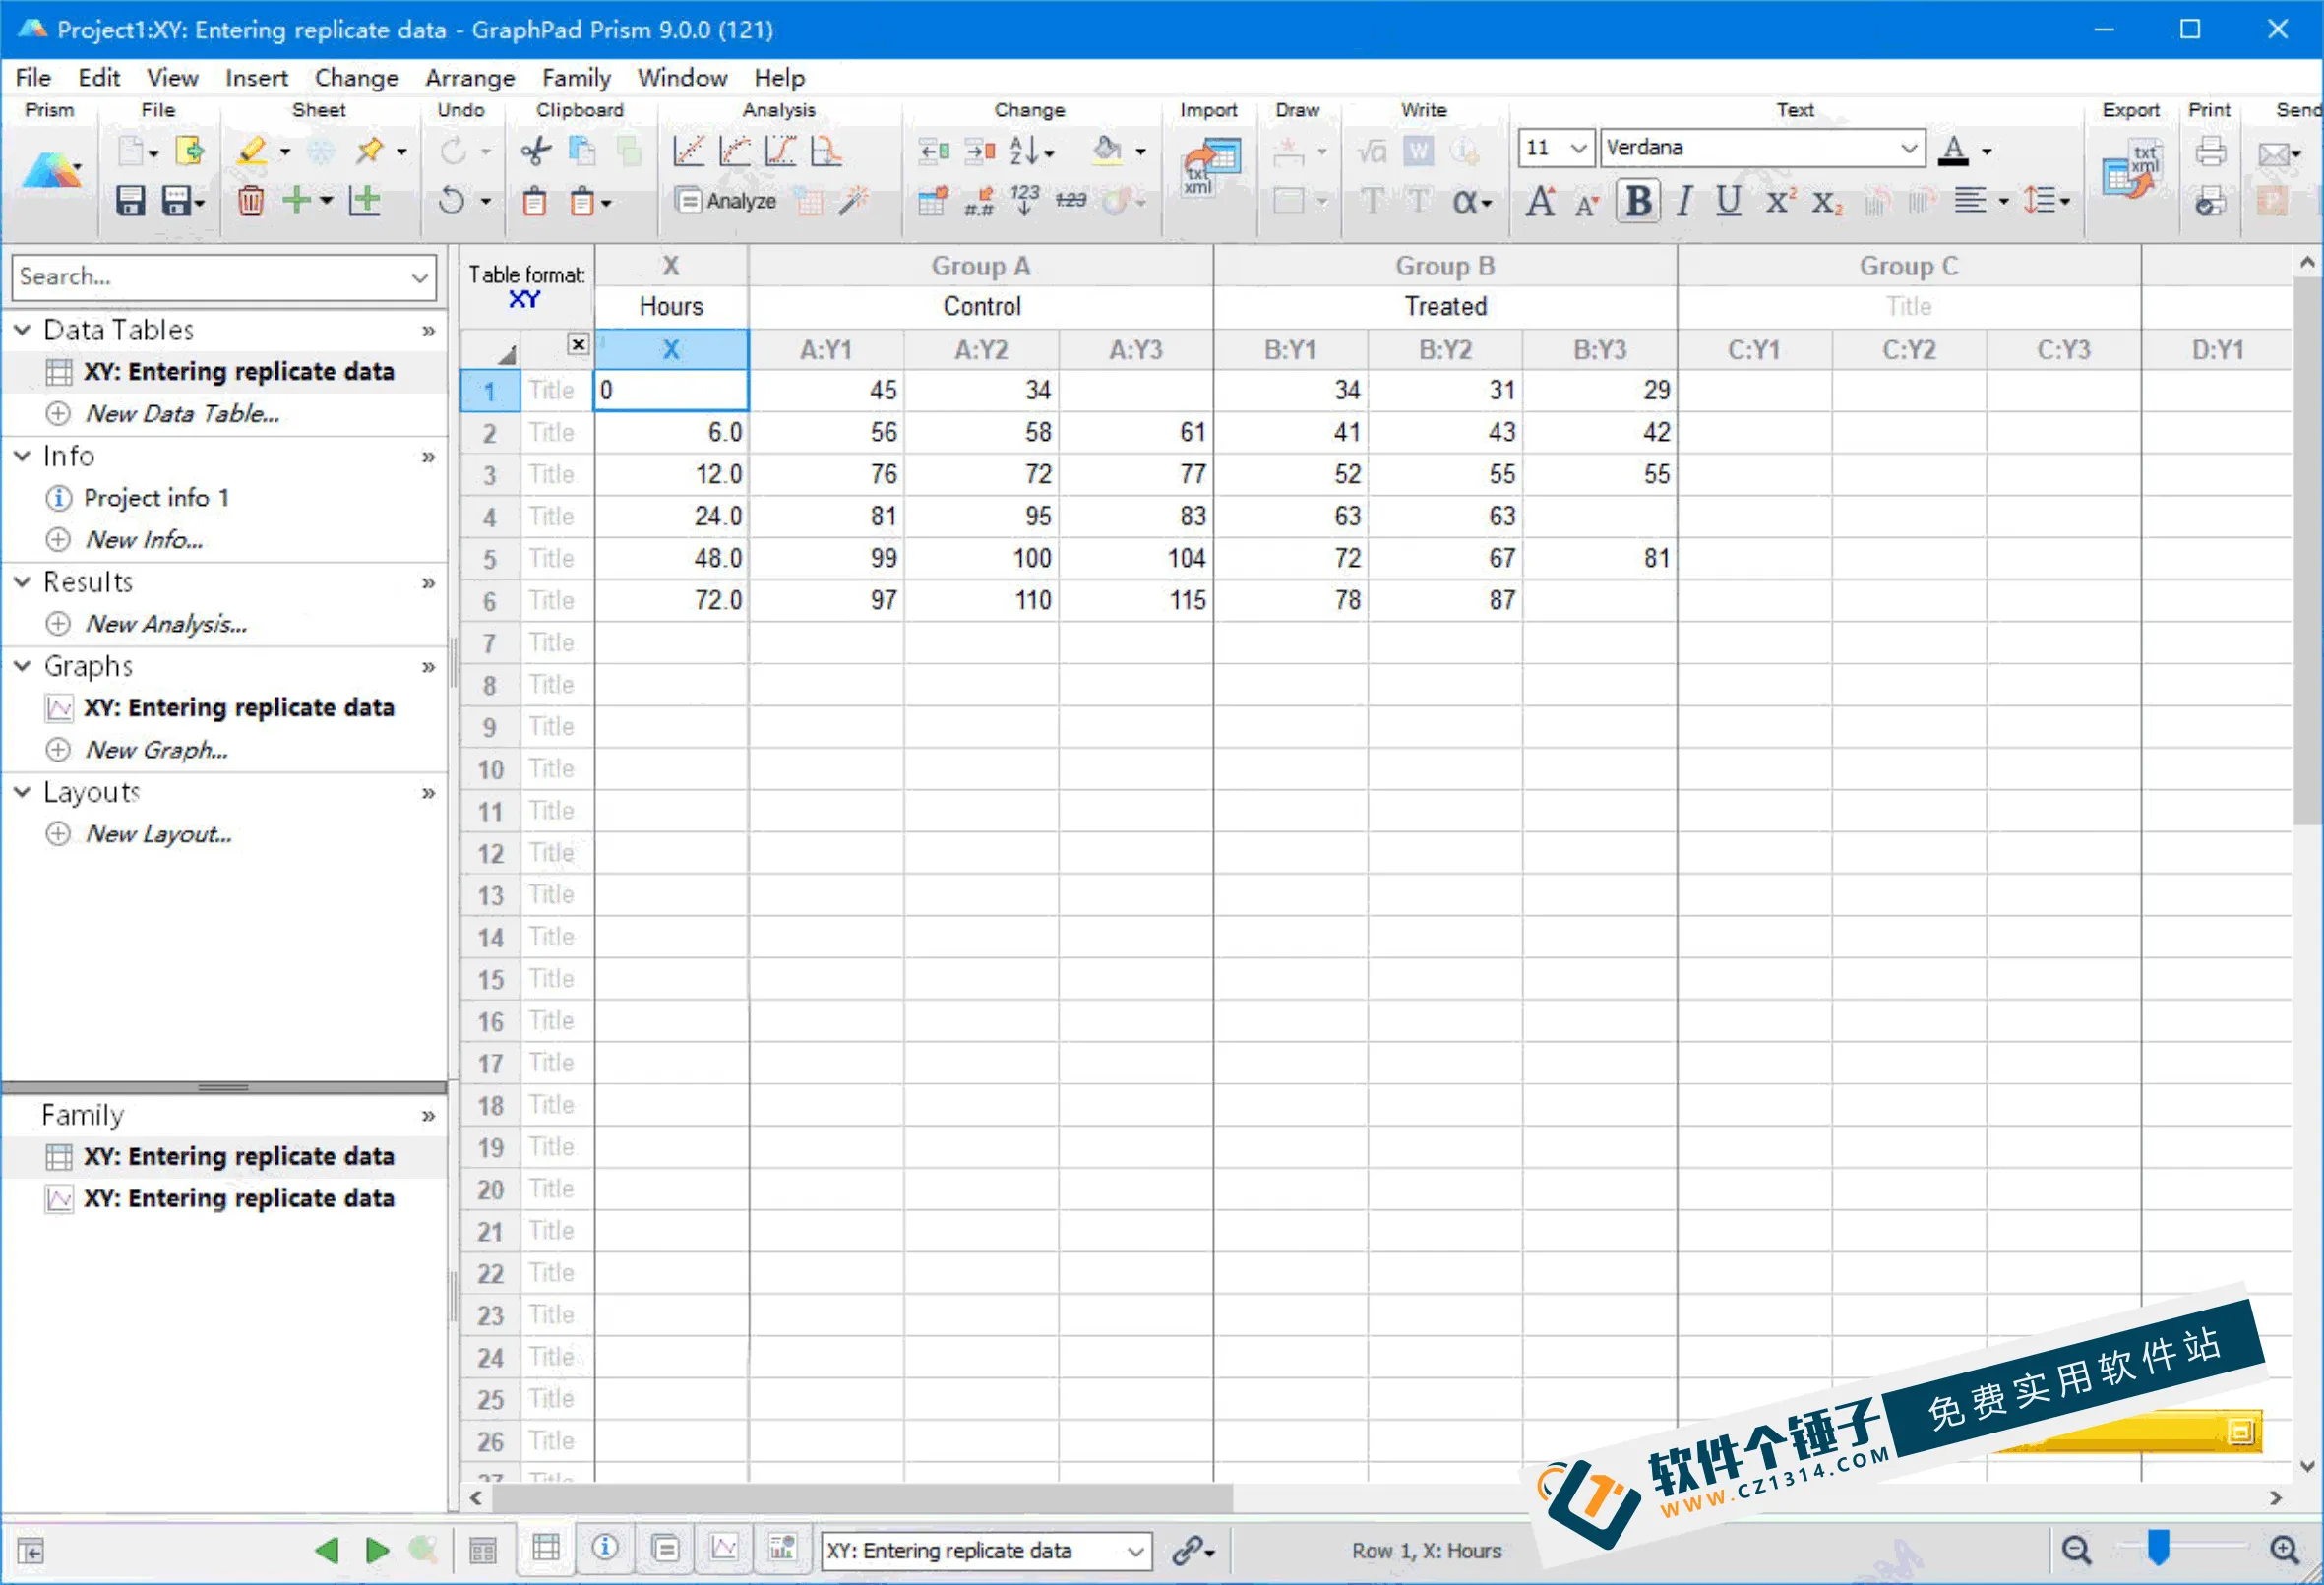
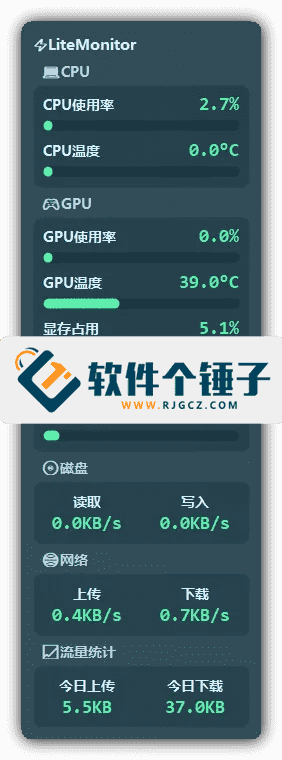
LiteMonitor is an ultra-lightweight real-time system monitoring tool made by a domestic developer, designed for users who need to always see key information such as CPU, memory, disk, network, and hardware temperatures on their desktop. For users who often struggle with how to quickly check system load while gaming, rendering, or live streaming, but don't want to open a complex task manager or run bloated monitoring software, it provides an efficient solution based on WMI and the Open Hardware Monitor engine.

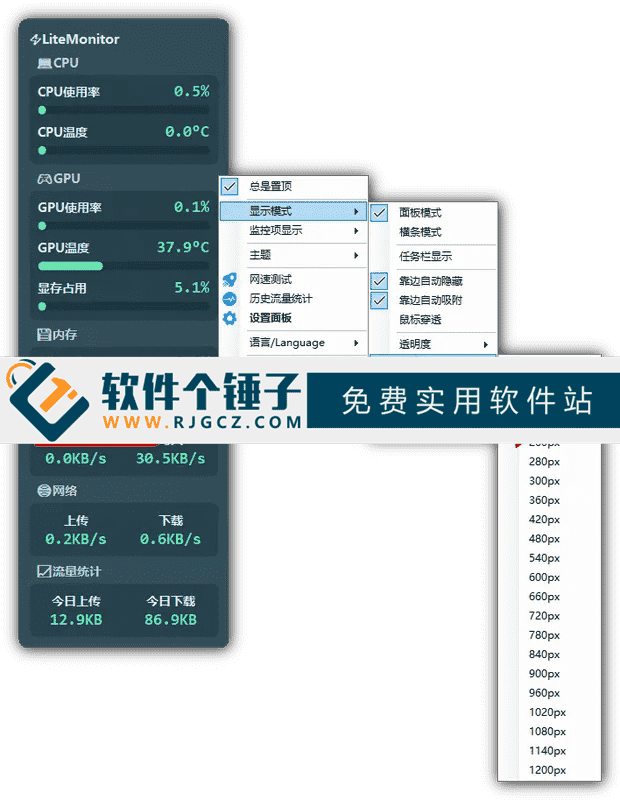
The software displays real-time data in a freely draggable overlay window, supporting customization of monitored items, refresh rate, font size, and window transparency. The main program is less than 1 MB in size and uses very few system resources (CPU usage <0.5%, memory usage <10 MB). It is ideal for performance tuning, stability testing, live-stream monitoring, and daily system status tracking. Compared to HWiNFO being too complex or MSI Afterburner requiring RivaTuner, LiteMonitor focuses on "ready to use + friendly Chinese interface + almost no configuration," perfectly meeting the core need for "a truly clean and intuitive desktop hardware monitoring tool."
What Practical Problems Does It Solve?
In daily computer use, many users hope to find a tool that can, for example, show GPU temperature and game frame rate in real time while playing a large game like Black Myth: Wukong, while also displaying whether memory usage is nearly full. By integrating Open Hardware Monitor's sensor reading capabilities, LiteMonitor can obtain motherboard, CPU, and GPU temperatures, voltages, and fan speeds. For the question "which small tool can monitor NVMe drive temperature on Win11, with an overlay that can display through fullscreen games," the answer lies in its always-on-top and global hook mechanism—even in exclusive fullscreen mode, its overlay can remain visible (you may need to disable the system's "Game Mode" or run the program as administrator). This feature is suitable for gamers monitoring hardware heat, video editors preventing stutter during rendering, programmers debugging high-load applications, or ordinary users preventing computer crashes caused by overheating.

Key Features at a Glance
- Real-time core metrics: CPU usage, memory, disk read/write, network upload/download speeds.
- Full hardware sensors: CPU, GPU, and motherboard temperatures, fan speeds, and voltages.
- Highly customizable overlay: drag, resize, and set transparency so it stays out of the way.
- Convenient system integration: auto-start on boot and minimize to tray—no taskbar space taken.
- Free layout: reorder monitored items and choose units (MB/s or KB/s for network).
- Flexible refresh rate: from 0.5 to 5 seconds, balancing real-time detail and resource usage.
- Portable: a single file of about 900 KB—no installation, no background services.
Core Advantages
-
- Extremely lightweight: under 1 MB, minimal resource usage.
- Clear information: real-time overlay of all key hardware statuses.
- Comprehensive: monitors CPU, GPU and drive temperatures.
- Easy to Learn: friendly UI with almost no learning curve.
- Clean & Undisturbed: no ads, no silent network calls.
- Wide Use Cases: gaming hardware monitoring, render progress, stability watching.
- Totally Free: personal and office use alike.
Related Courses
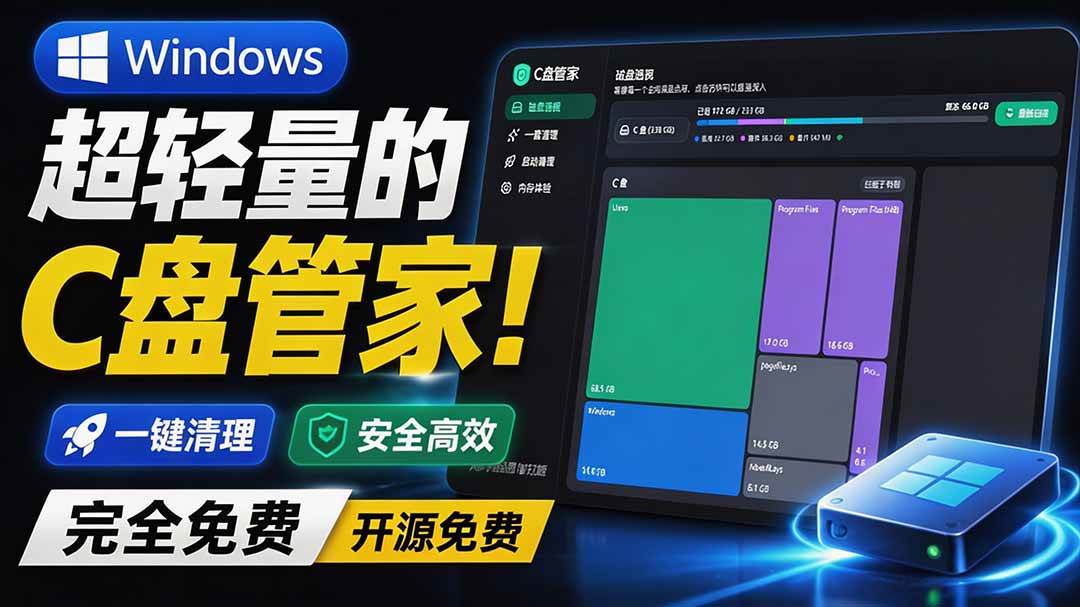
Super-lightweight C-Drive Manager for Windows! Very distinctive: disk analysis and cleanup reminders, 2MB size, completely free

Reinstall Without a USB Drive! This Tool Lets Newbies Quickly Reinstall Windows, Supports Unattended Setup, Data-Safe—CmzPrep_Rev2

A GitHub speed-up tool! Open GitHub faster, auto-responding to the fastest node - a lightweight open-source tool: Ghips

EasyRC: one-click Windows reinstall without USB, backup and restore included

Permanently Block Windows 10/11 Updates: Huawei Tool, Avoid Frequent Win Update Problems
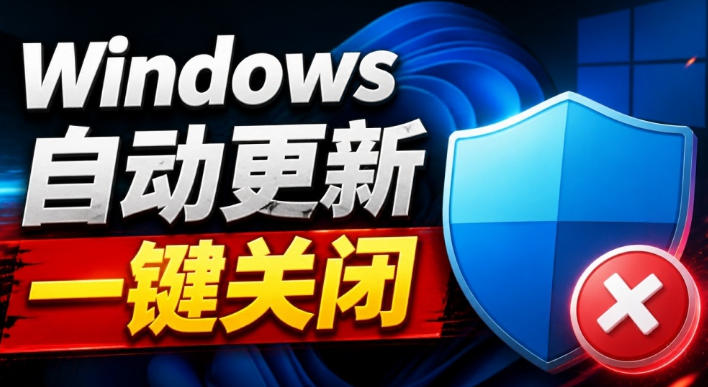
Windows 7/10/11 System Update Blocker Is Here! Only 400KB, One-Click Disable System Updates and Restore Updates, Compact and Easy to Use

Stop Deleting Files Randomly! C Drive Red Alert Savior: Deep Cleanup + System Optimization, Works on Windows/macOS!

Office Fully-Automatic One-Click Deployment Installer, up to 2024, Customizable Components, Built-in Activation, All Free - Mocreak

Windows System Reinstall Tool, Supports Local Image File Install and Backup, Simple to Use, Safe and Stable, Supports All Scenarios

PC Acting Up? Newbie-Essential Driver Repair Tool—One-Click Update & Fix Driver Issues, It’s That Simple