Categories
See All >
-
Solo Business Courses
-
 Others
-
Overseas Tutorials
-
Photography & Editing
-
Community & Private Domain
-
Self-Media Writing & Copywriting
-
Side Income Projects
-
E-commerce
-
Short Video & Live Streaming
-
Artificial Intelligence (AI)
-
Software & Tools
-
Operating Systems
-
Plugins & Scripts
-
MacOS Software
-
Android Software
-
Windows Software
Statistical Graphing Software GraphPad Prism Win10.6.0.890 / Mac10.5.0.673 [Software Gechuzi·R1609]
📚Video Course
🕒Last updated: 08/26/2025
👥Entrepreneurs / Self-media creators / Cross-border e-commerce sellers / Side-hustlers
Study material — included with membership
Unlock Course with Membership
🔓
Get this course for reference study with membership
📦
Join membership — study all 16742 courses & software tools as reference
🔄
Courses keep updating — members study new material as it arrives
Share:
Top Selling Courses
-
Game Gold-Farming Money-Making Plan: Earn 1k+ Daily, a Stable 3-Year Project Anyone Can Do in Spare Time [Revealed]
Study material — included with membership Get Membership -
Hot-game fully-automated earning: 500+ a day, no experience, simple operation - the steadiest long-term game-earning side hustle (revealed)
Study material — included with membership Get Membership -
FlyingMouse earns merit this time! Don't panic at Windows format problems — the open-source FlyingMouse format conversion tool helps, a popular GitHub gem
Study material — included with membership Get Membership -
Douyin Product-Selling Coaching Bootcamp: No On-Camera Appearance Needed, Newbies Can Produce Selling Short Videos by Following the Steps
Study material — included with membership Get Membership -
First-release game gold-farming money plan: 1K+ a day, ordinary people in spare time
Study material — included with membership Get Membership






Top Selling Software Tools
-
FlyingMouse earns merit this time! Don't panic at Windows format problems — the open-source FlyingMouse format conversion tool helps, a popular GitHub gem
Study material — included with membership Get Membership -
LuDaShi v6.1024.4105.1121 Slim Single File
Study material — included with membership Get Membership -
2D Cartoon Animation Software Moho Pro v14.3
Study material — included with membership Get Membership -
Video Editor Aiseesoft Filmai v1.0.18
Study material — included with membership Get Membership -
To-Do Microsoft To Do v2.147 Free
Study material — included with membership Get Membership -
PR/AE/DaVinci/FCPX video Plugin Nobe OmniScope Win1.11.15 / Mac1.10.138
Study material — included with membership Get Membership


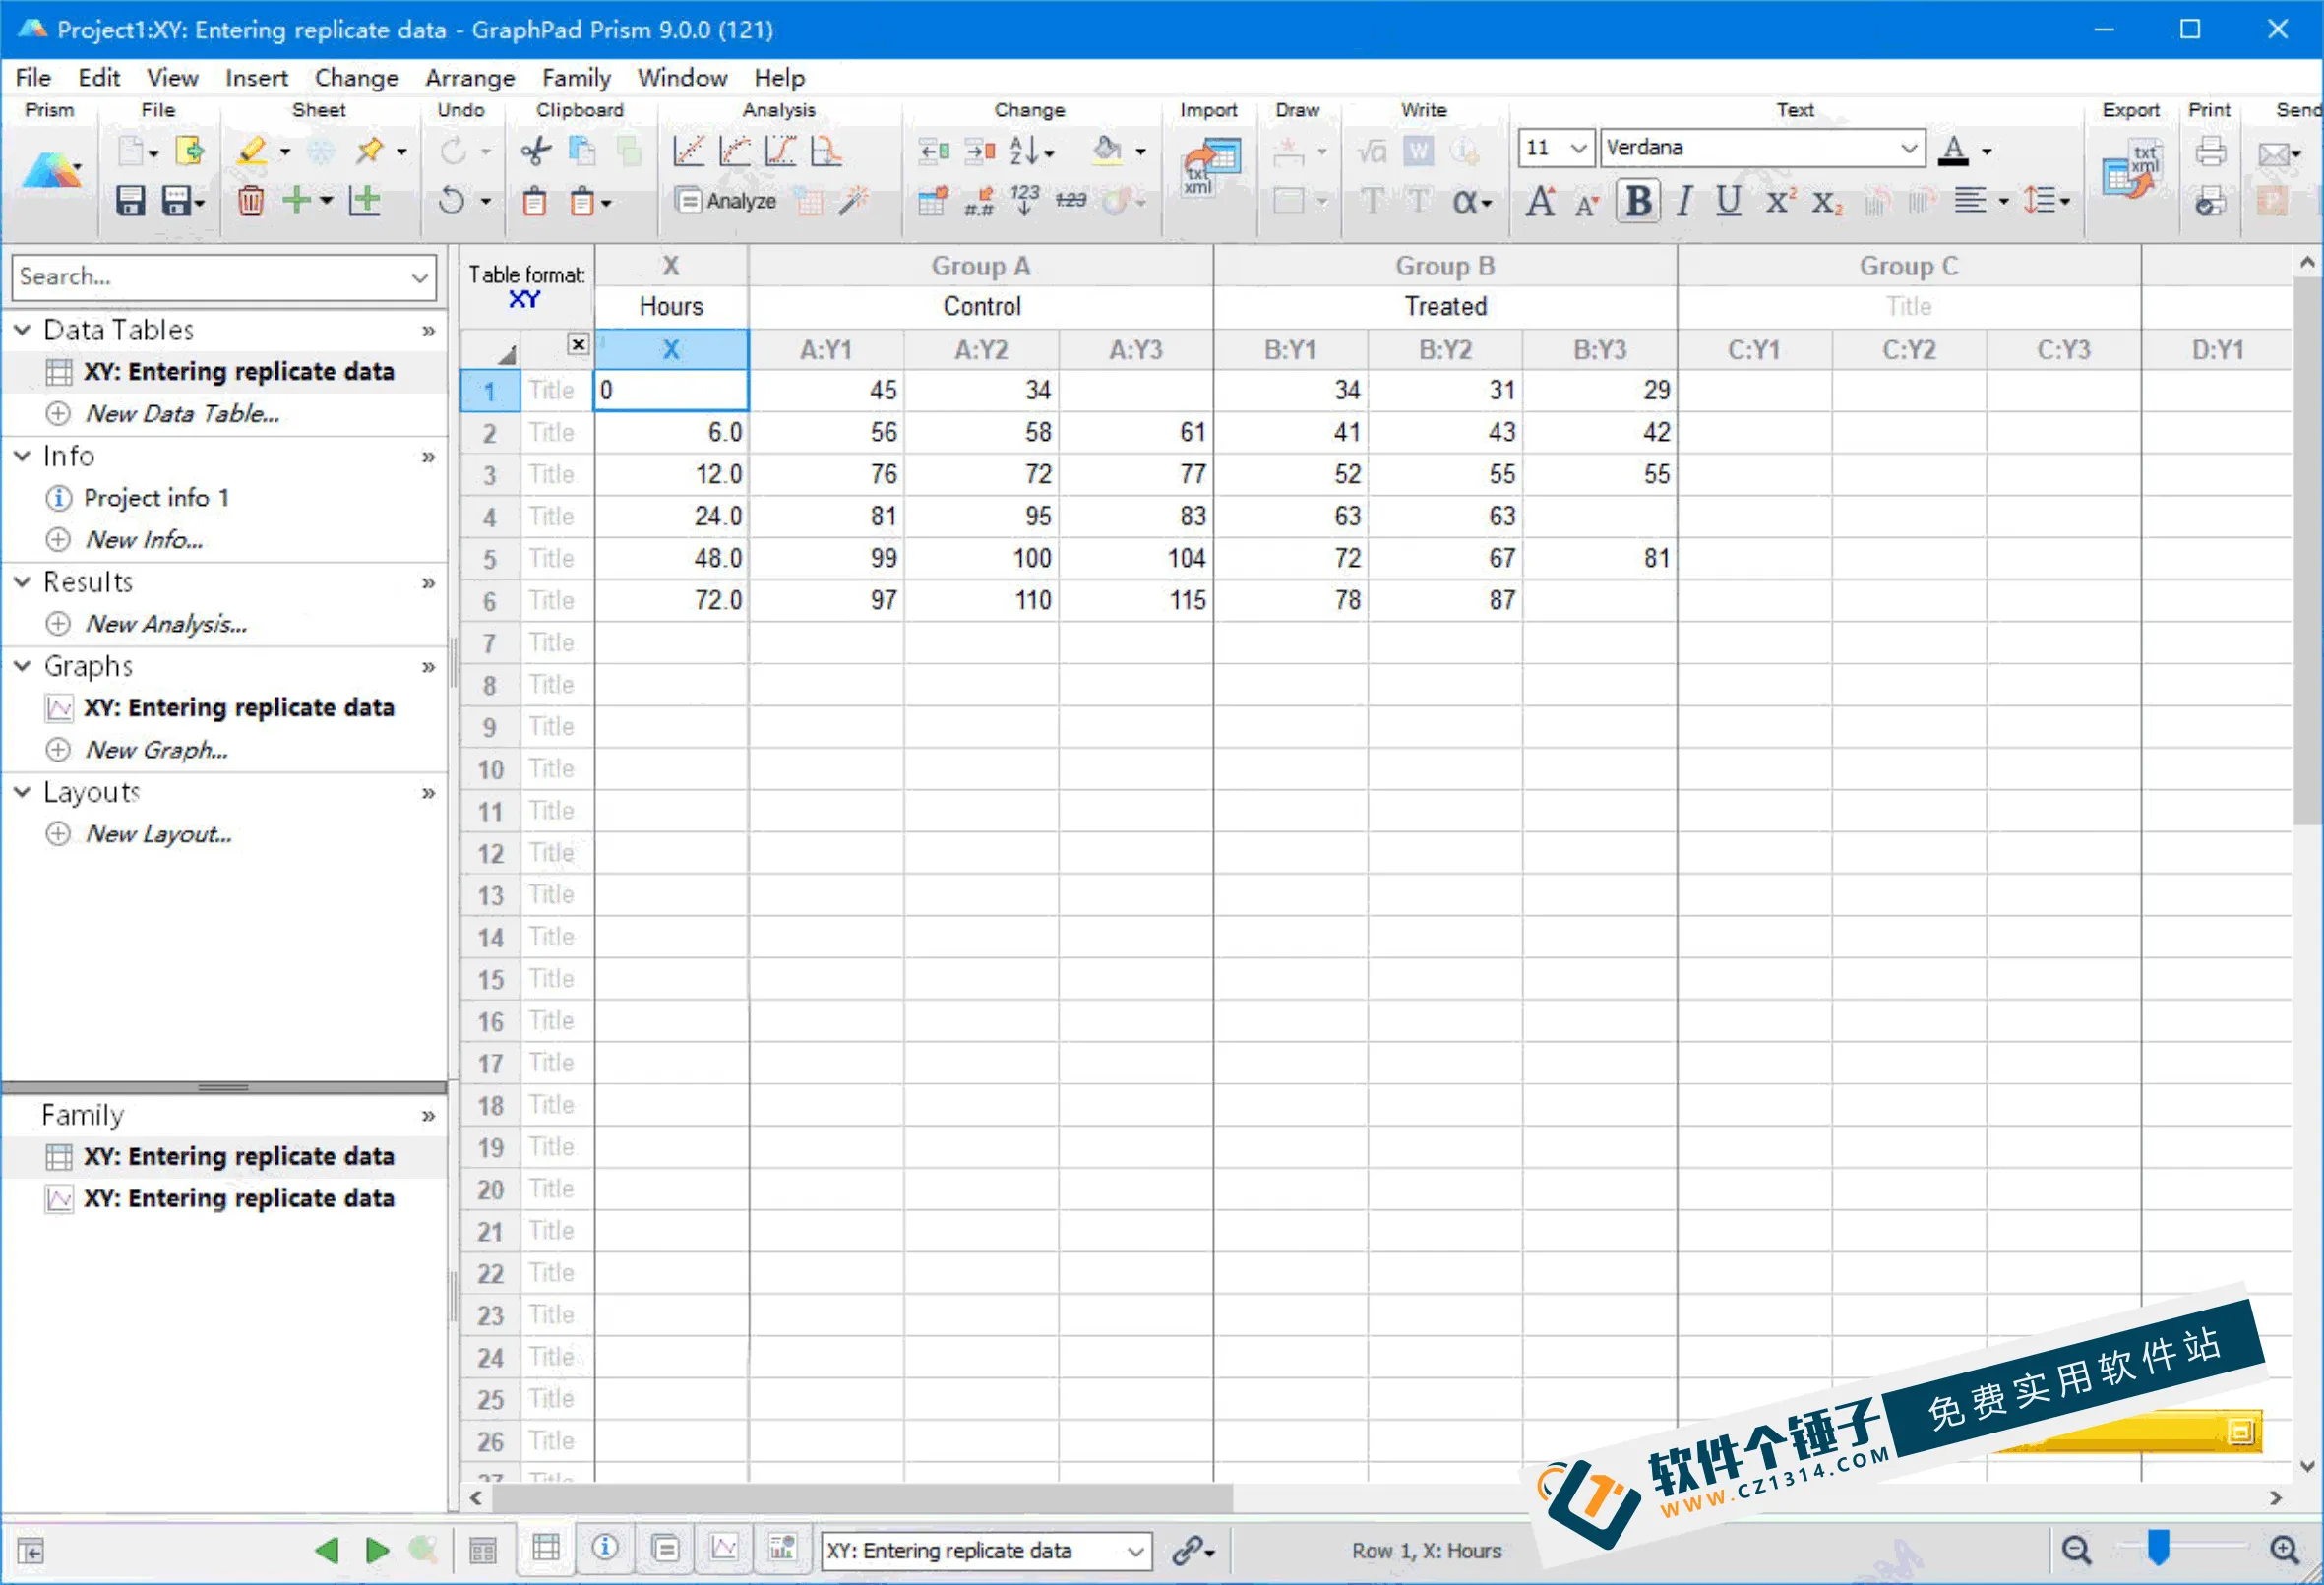


GraphPad Prism features
\1. Statistical comparisons
\- \
- Fisher's exact test or chi-square test: Calculate confidence intervals for relative risk and odds ratio. \
- ANOVA: Brown-Forsythe and Welch one-way ANOVA without equal-SD assumption, followed by post tests. \
- Nonparametric one-way ANOVA: Kruskal-Wallis or Friedman with Dunn post test. \
- Two-way ANOVA: for repeated measures; Tukey, Newman-Keuls, Dunnett, Bonferroni, Holm-Sidak or Fisher LSD multiple comparisons. \
- Greenhouse-Geisser correction: sphericity-free one-, two- and three-way ANOVA. \
- Volcano plots: auto-generated from multiple t-tests. \
- Multiple t-tests: choose comparisons for follow-up by false discovery rate. \
- Mann-Whitney: confidence interval for the median difference. \
- Paired or unpaired t-test: P value and confidence interval reported. \
- Survival analysis: Kaplan-Meier curves, compared by log-rank test. \
2. Column statistics
\- \
- Lognormality test: likelihood of sampling from normal vs. log-normal distributions. \
- Descriptive statistics: min, max, mean, SD, SEM, CI, coefficient of variation. \
- Outlier detection: Grubbs or ROUT methods. \
- Normality tests: four methods available. \
3. Nonlinear regression
\- \
- Curve plotting: auto-plot over a chosen X range. \
- Model tests: run or copy tests of model adequacy. \
- Global nonlinear regression: share parameters across data sets. \
- Residual analysis: test residual normality. \
- Parameter comparisons: compare parameters across data sets. \
- Equation fitting: fit one of 105 built-in equations, or enter your own. \
4. Other calculations
\- \
- Normalization & transform: transpose tables, transform data, identify outliers. \
- Area under curve: with confidence interval. \
- Baseline subtraction: subtract baselines and merge columns. \
- Fractions: express each value as a fraction of its row, column or total. \
What’s new
\- \
- Scree plots, score plots and biplots. \
- Automatic variable coding — enter text directly into data tables. \
- Principal components regression — PCA results prepared for multiple linear regression. \
- Column limit raised — up to 1024 columns per data table. \
- Parallel analysis to choose components. \
Install & activate
\- \
- Download and install GraphPad Prism. \
- Close the app after install; do not run it yet. \
- Copy the patch files into the install directory. \
- Open the app — activation complete. \
Related Courses
Study material — included with membership
Get Membership
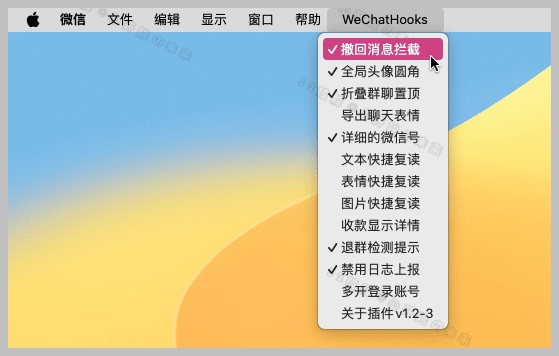
WeChat Multi-Instance & Anti-Recall Tool WeChatHooks v1.2-3 Single-File Mac
Study material — included with membership
Get Membership
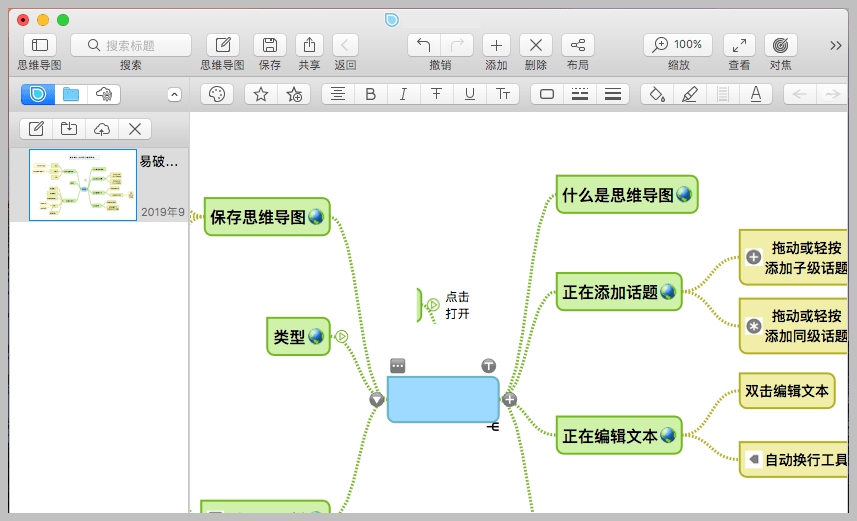
Apple TNT Mind-Mapping App SimpleMind Pro for Mac v2.3.5 Official Free Edition
Study material — included with membership
Get Membership
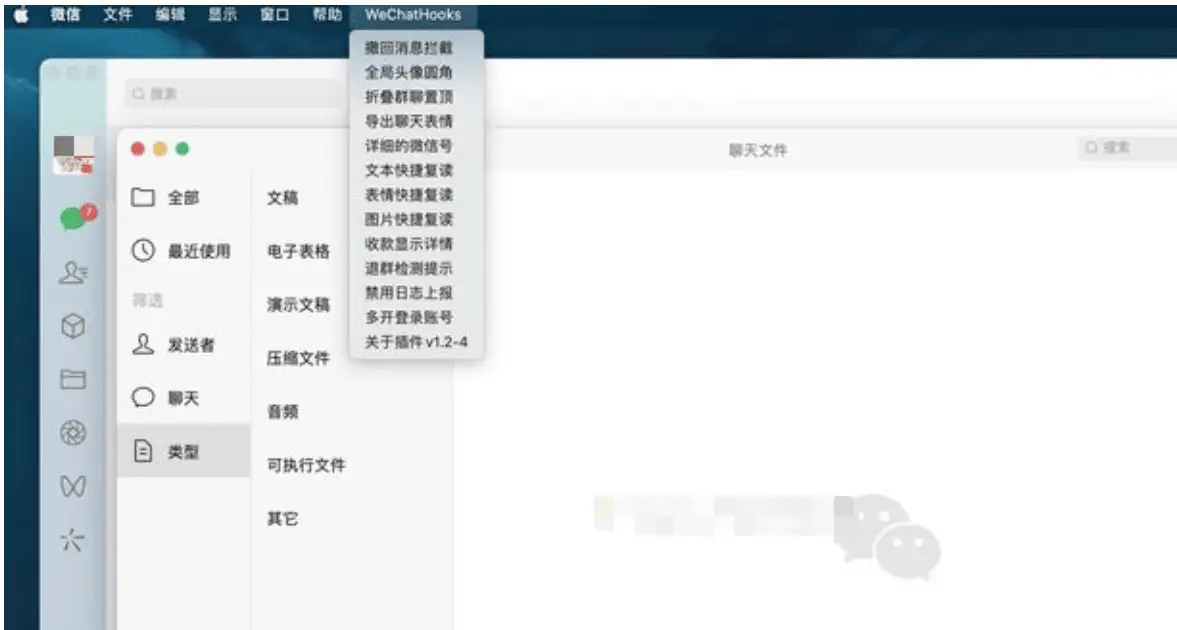
Mac WeChat Plugin WeChatHooks v1.2.4 Free - Multi-Account & Anti-Recall
Study material — included with membership
Get Membership
AI Smart Cutout Tool XianYi AI Cutout v3.1 Win/Mac Offline Version Supports Batch Cutout and AI Removal
Study material — included with membership
Get Membership
3D Fashion Design Software Marvelous Designer Win2024.2.113/Mac7.5
Study material — included with membership
Get Membership
Vector Editor / UI-UX Tool Sketch Mac2025.2.1 Free
Study material — included with membership
Get Membership
Sogou Pinyin Input Win16.4.0.3497 / Mac6.18.1.10104
Study material — included with membership
Get Membership
3D Modeling Renderer The Foundry Modo Win17.1v1 / Mac15.1v2
Study material — included with membership
Get Membership
DB Management TablePlus Win26.9.8 / Mac6.4.4

Study material — included with membership
Get Membership
P2P File Seeding Sharing Software FrostWire v3.0.15.769 Win/Mac

China Projects — one person, one company. No team, no middlemen. Every model here is already proven in China. Join the membership, study it as reference, and launch it locally in your country.