Categories
See All >
-
Solo Business Courses
-
 Others
-
Overseas Tutorials
-
Photography & Editing
-
Community & Private Domain
-
Self-Media Writing & Copywriting
-
Side Income Projects
-
E-commerce
-
Short Video & Live Streaming
-
Artificial Intelligence (AI)
-
Software & Tools
-
Operating Systems
-
Plugins & Scripts
-
MacOS Software
-
Android Software
-
Windows Software

Statistics & Graphing — GraphPad Prism
📚Video Course
🕒Last updated: 09/02/2024
👥Entrepreneurs / Self-media creators / Cross-border e-commerce sellers / Side-hustlers
Study material — included with membership
Unlock Course with Membership
🔓
Get this course for reference study with membership
📦
Join membership — study all 16742 courses & software tools as reference
🔄
Courses keep updating — members study new material as it arrives
Share:
Top Selling Courses
-
Game Gold-Farming Money-Making Plan: Earn 1k+ Daily, a Stable 3-Year Project Anyone Can Do in Spare Time [Revealed]
Study material — included with membership Get Membership -
Hot-game fully-automated earning: 500+ a day, no experience, simple operation - the steadiest long-term game-earning side hustle (revealed)
Study material — included with membership Get Membership -
FlyingMouse earns merit this time! Don't panic at Windows format problems — the open-source FlyingMouse format conversion tool helps, a popular GitHub gem
Study material — included with membership Get Membership -
Douyin Product-Selling Coaching Bootcamp: No On-Camera Appearance Needed, Newbies Can Produce Selling Short Videos by Following the Steps
Study material — included with membership Get Membership -
First-release game gold-farming money plan: 1K+ a day, ordinary people in spare time
Study material — included with membership Get Membership






Top Selling Software Tools
-
FlyingMouse earns merit this time! Don't panic at Windows format problems — the open-source FlyingMouse format conversion tool helps, a popular GitHub gem
Study material — included with membership Get Membership -
LuDaShi v6.1024.4105.1121 Slim Single File
Study material — included with membership Get Membership -
2D Cartoon Animation Software Moho Pro v14.3
Study material — included with membership Get Membership -
Video Editor Aiseesoft Filmai v1.0.18
Study material — included with membership Get Membership -
To-Do Microsoft To Do v2.147 Free
Study material — included with membership Get Membership -
PR/AE/DaVinci/FCPX video Plugin Nobe OmniScope Win1.11.15 / Mac1.10.138
Study material — included with membership Get Membership


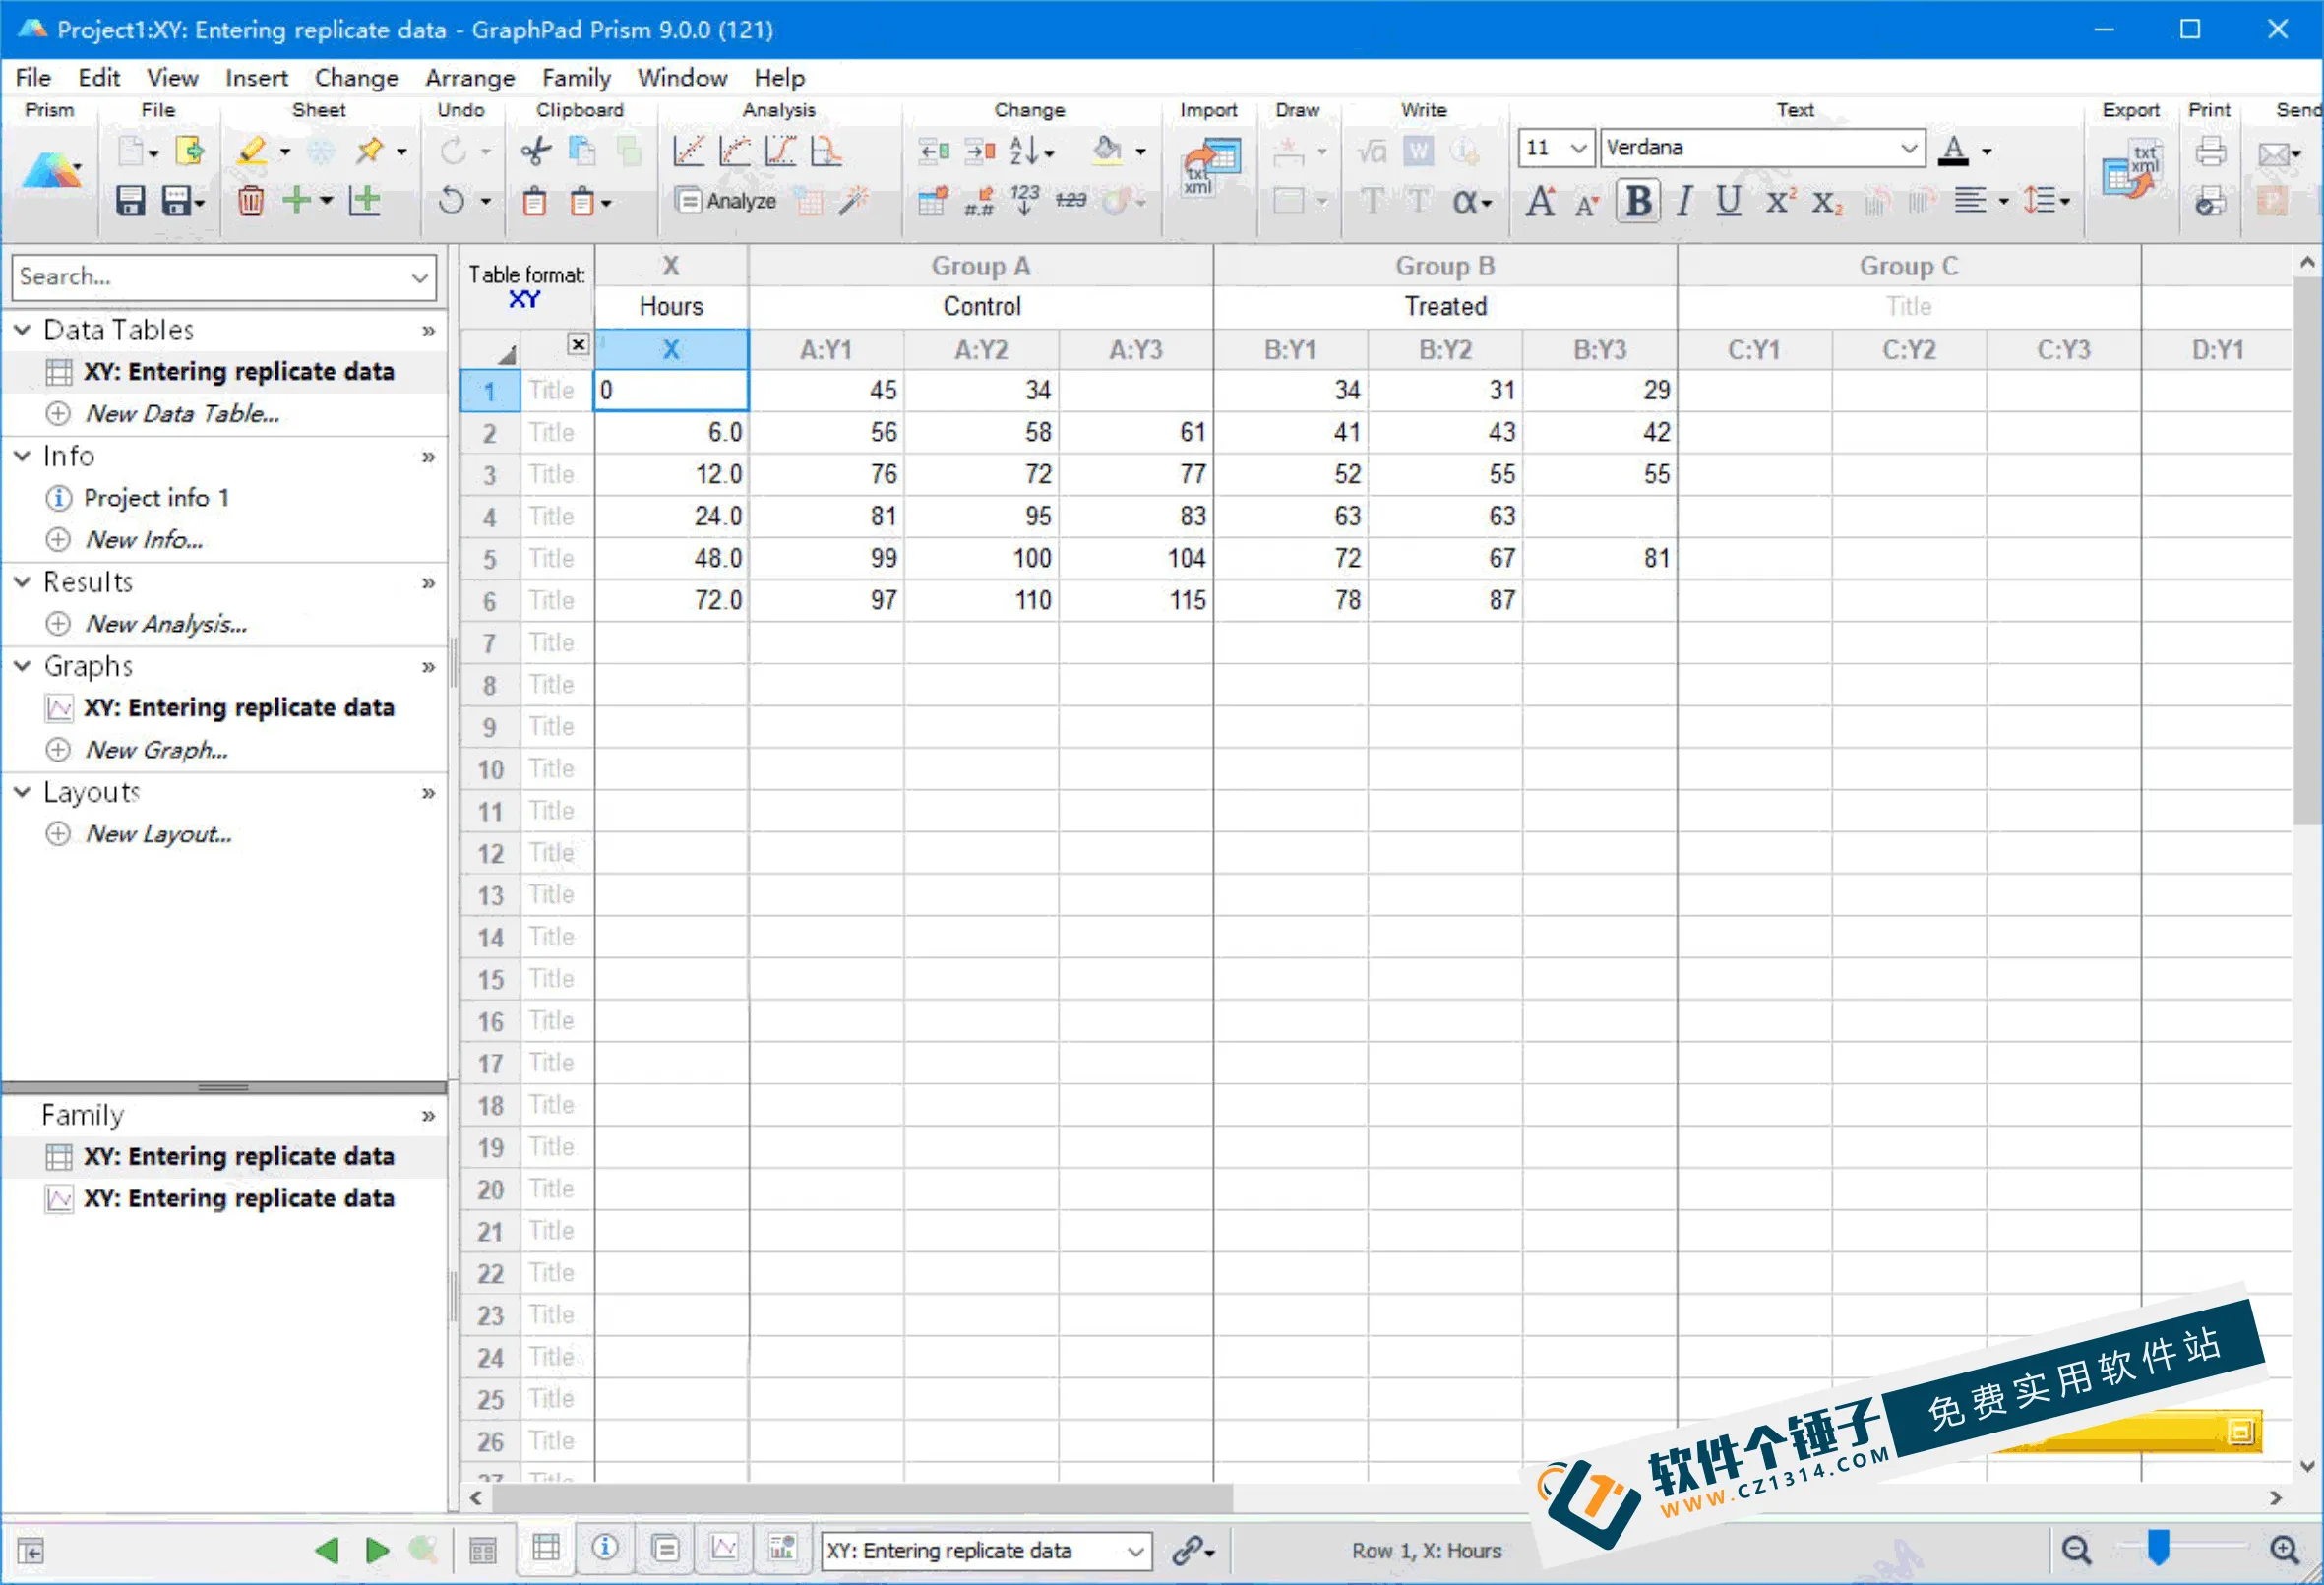
GraphPad Prism is a designed for PC professional statistical plotting software, combining biostatistics, scientific plotting and curve fitting. Built for researchers to easily run analysis and generate professional charts.
\ \GraphPad Prism feature overview
\ \1. Statistical comparison features
\ \- \
\
- provides Fisher's exact test or chi-square testto calculate relative risk and odds ratio. \ \
- It allows one-way ANOVA using Brown-Forsythe and Welch ANOVA without assuming equal group standard deviations, with appropriate comparison tests. \ \
- supports Kruskal-Wallis or Friedman nonparametric one-way ANOVA with Dunn's post hoc Kruskal-Wallis or Friedman nonparametric one-way ANOVA。 \ \
- supports two-way ANOVA for repeated measures data with one or two factors Two-way ANOVAand provides multiple multiple-comparison tests. \ \
- automatically generates volcano plots for multiple t-test analyses, and allows the use of mixed-effects model to handle missing data. \ \
- provides non-parametric Mann-Whitney test and Kaplan-Meier survival analysis and other features to help users better perform statistical analysis. \ \
2. Column Statistics
\ \- \
\
- It supports log-normality tests and batch p-value analysis, applying Bonferroni multiple-comparison or FDR methods to identify 'significant' findings. \ \
- calculates descriptive statistics, including mean, standard deviation, confidence intervals, etc. \ \
- It offers several normality tests, such as Anderson-Darling, and creates QQ plots as part of normality testing.
 \
\
3. Nonlinear Regression
\ \- \
\
- supports automatically plotting curves within a specified range of X values, and provides multiple model adequacy tests. \ \
- allows input of differential or implicit equations, and performs differential weighting through several methods. \ \
- provides global nonlinear regression, and can compare parameters between datasets, generating confidence bands or prediction bands. \ \
- provides 105 built-in equations, and supports user input of custom equations. \ \
4. Other Calculation Features
\ \- \
\
- provides data standardization, table transposition and data transformation features. \ \
- supports area under the curve calculation, and provides confidence interval calculation. \ \
- allows identification of outliers and normality tests.
 \
\
New features in GraphPad Prism
\ \- \
\
- supports generating pie charts, bar charts and heatmaps. \ \
- automatically identifies the type of variable in multi-variable data tables, and performs automatic variable encoding. \ \
- automatically prepares PCA results, and supports multiple linear regression analysis. \ \
- improves the data row limit, allowing up to 1024 rows of data per data table. \ \
- makes selection easier through methods such as peace line analysis, providing more flexible data analysis options. \ \
GraphPad Prism Its power and new features make Prism ideal for research statistics and data visualization. Whether biostatistics, scientific plotting or complex curve fitting, it handles tasks efficiently with accurate results.
\ \\ \ \ \
Related Courses
Study material — included with membership
Get Membership
WeChat Multi-Instance & Anti-Recall Tool WeChatHooks v1.2-3 Single-File Mac
Study material — included with membership
Get Membership
Apple TNT Mind-Mapping App SimpleMind Pro for Mac v2.3.5 Official Free Edition
Study material — included with membership
Get Membership
Mac WeChat Plugin WeChatHooks v1.2.4 Free - Multi-Account & Anti-Recall
Study material — included with membership
Get Membership
AI Smart Cutout Tool XianYi AI Cutout v3.1 Win/Mac Offline Version Supports Batch Cutout and AI Removal
Study material — included with membership
Get Membership
3D Fashion Design Software Marvelous Designer Win2024.2.113/Mac7.5
Study material — included with membership
Get Membership
Vector Editor / UI-UX Tool Sketch Mac2025.2.1 Free
Study material — included with membership
Get Membership
Sogou Pinyin Input Win16.4.0.3497 / Mac6.18.1.10104
Study material — included with membership
Get Membership
3D Modeling Renderer The Foundry Modo Win17.1v1 / Mac15.1v2
Study material — included with membership
Get Membership
DB Management TablePlus Win26.9.8 / Mac6.4.4

Study material — included with membership
Get Membership
P2P File Seeding Sharing Software FrostWire v3.0.15.769 Win/Mac
China Projects — one person, one company. No team, no middlemen. Every model here is already proven in China. Join the membership, study it as reference, and launch it locally in your country.