-
Solo Business Courses
-
 Others
-
Overseas Tutorials
-
Photography & Editing
-
Community & Private Domain
-
Self-Media Writing & Copywriting
-
Side Income Projects
-
E-commerce
-
Short Video & Live Streaming
-
Artificial Intelligence (AI)
-
Software & Tools
-
Operating Systems
-
Plugins & Scripts
-
MacOS Software
-
Android Software
-
Windows Software

Aikewang Hands-On Training: An Excel Automated-Reporting Course for SEM & Feed-Ad Operators
-
Game Gold-Farming Money-Making Plan: Earn 1k+ Daily, a Stable 3-Year Project Anyone Can Do in Spare Time [Revealed]
Study material — included with membership Get Membership -
Hot-game fully-automated earning: 500+ a day, no experience, simple operation - the steadiest long-term game-earning side hustle (revealed)
Study material — included with membership Get Membership -
FlyingMouse earns merit this time! Don't panic at Windows format problems — the open-source FlyingMouse format conversion tool helps, a popular GitHub gem
Study material — included with membership Get Membership -
Douyin Product-Selling Coaching Bootcamp: No On-Camera Appearance Needed, Newbies Can Produce Selling Short Videos by Following the Steps
Study material — included with membership Get Membership -
First-release game gold-farming money plan: 1K+ a day, ordinary people in spare time
Study material — included with membership Get Membership






-
FlyingMouse earns merit this time! Don't panic at Windows format problems — the open-source FlyingMouse format conversion tool helps, a popular GitHub gem
Study material — included with membership Get Membership -
LuDaShi v6.1024.4105.1121 Slim Single File
Study material — included with membership Get Membership -
2D Cartoon Animation Software Moho Pro v14.3
Study material — included with membership Get Membership -
Video Editor Aiseesoft Filmai v1.0.18
Study material — included with membership Get Membership -
To-Do Microsoft To Do v2.147 Free
Study material — included with membership Get Membership -
PR/AE/DaVinci/FCPX video Plugin Nobe OmniScope Win1.11.15 / Mac1.10.138
Study material — included with membership Get Membership



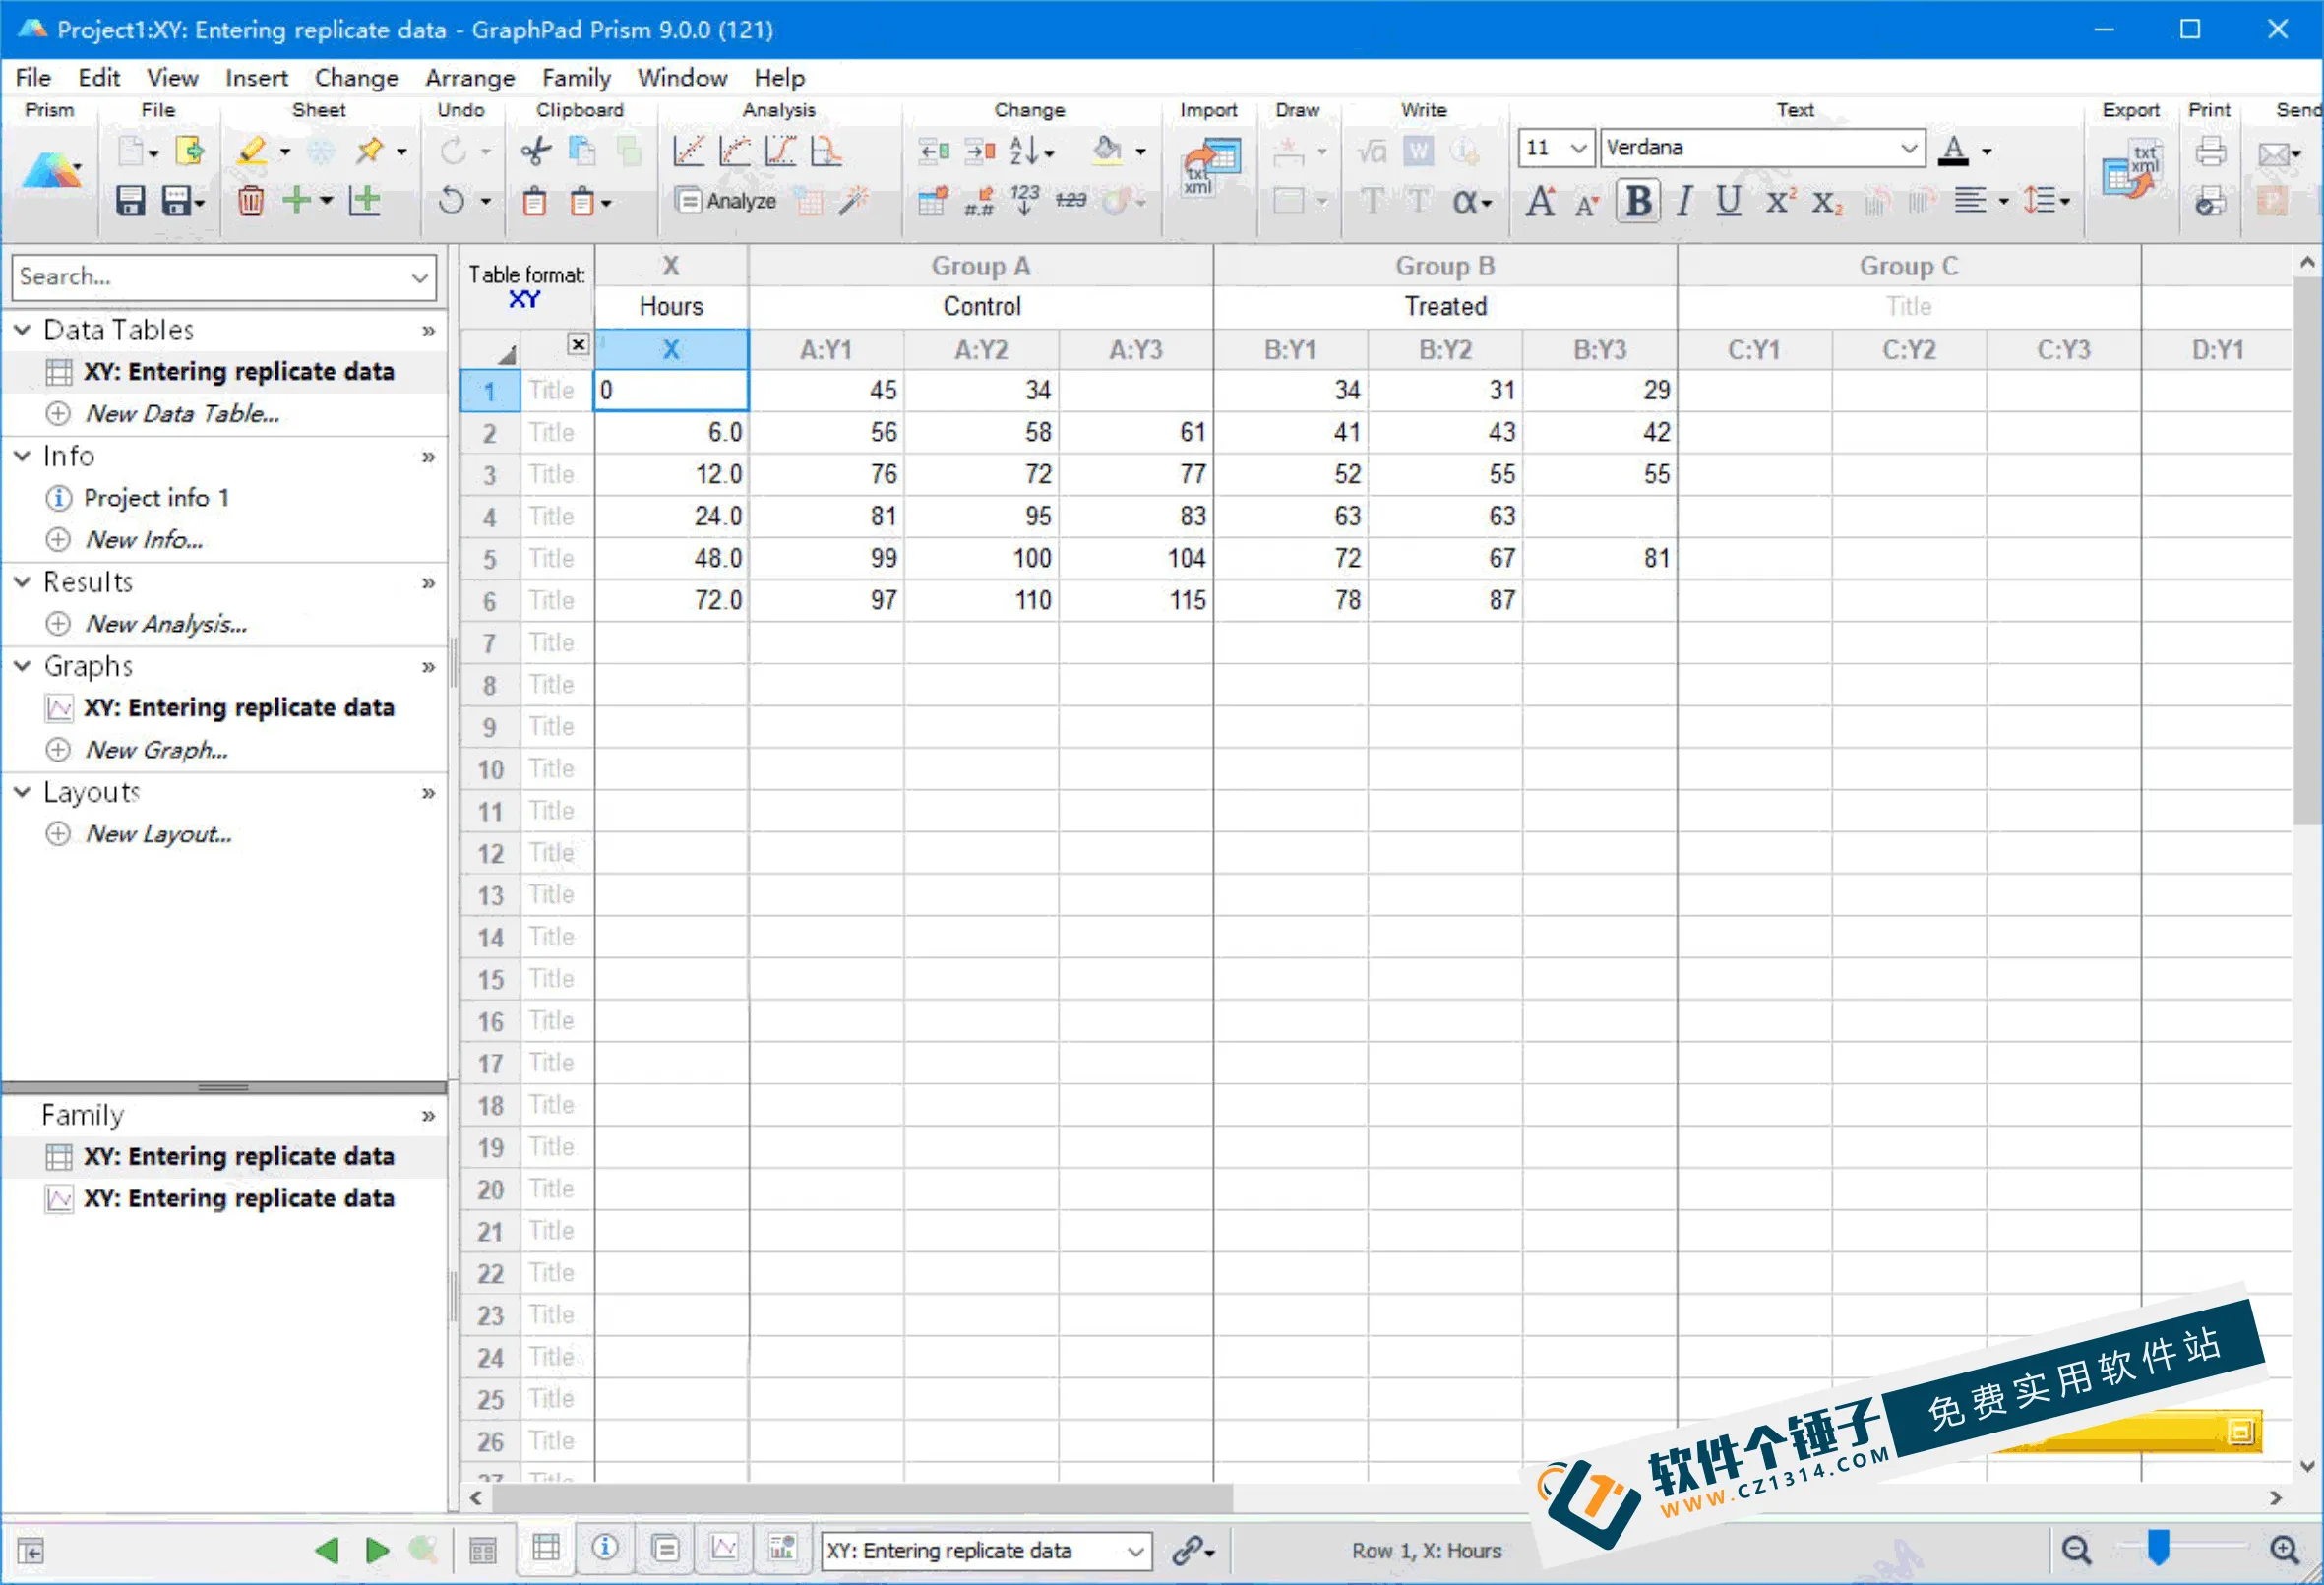
Aikewang Hands-On Training: An Excel Automated-Reporting Course for SEM & Feed-Ad Operators
\Course outline:
\Module 1: Excel Basics & Advanced Skills
– 1.1 Introduction to the Excel Data-Analysis Course
– Course goals and content overview.
– 1.2 Common Excel Shortcuts & Operations
– Teaching shortcuts and basic operations to speed up data work.
– 1.3 Excel Analysis Basics: Relative & Absolute References
– How relative and absolute references are used in analysis.
– 1.4 Practical Excel Skill: Find & Replace Data
– How to efficiently find and replace data.
Module 2: Excel Functions & Data Processing
– 2.1.1 Date Functions – A Must-Learn for Data Analysis
– Why date functions matter in analysis.
–. 2.1.2 Logical Functions –. A Must-Learn
–. Basic logical functions and their use in analysis.
–. 2.1.3 Common Functions
–. How to use the common functions.
–. 2.1.4 The VLOOKUP Function –. A Must-Master
–. How VLOOKUP works, with real cases.
–. 2.1.5 The SUMIFS Function –. A Must-Master
–. How SUMIFS is used in real data analysis.
–. 2.1.6 The COUNTIFS Function –. A Must-Master
–. How to do conditional counting with COUNTIFS.
–. 2.1.7 Another Use of COUNTIFS
–. Exploring advanced uses of COUNTIFS.
Module 3: PowerQuery & Data Integration
–. 2.3.1 Case: Merging Search-Term Reports With PowerQuery
–. A hands-on example of merging different data sources.
–. 2.3.2 Simple Data Processing & Append-Merge in PowerQuery
–. How to clean and merge data with PowerQuery.
–. 2.3.3 Batch-Merging Excel Files With PowerQuery
–. How to batch-process and merge multiple Excel files.
–. 2.3.4 Tidying Data Sources –. Wide to Long Format
–. Techniques for converting multi-dimensional data into one dimension.
–. 2.3.5 The PowerQuery De-dup & Summarize Method –. Using Group By
–. How to de-duplicate and summarize data.
–. 2.3.6 The Super-VLOOKUP for Multi-Table Merges in PowerQuery
–. How to run a super-VLOOKUP across tables.
–. 2.3.7 Quickly Handling [Unconventional] Data Merges With PowerQuery
–. How to handle complex merge requirements.
Module 4: PivotTables & Advanced Analysis
–. 2.2.1 Applying Table Styles –. PivotTables
–. How to quickly organize and analyze data with PivotTables.
–. 2.2.2 Raw-Data Requirements for PivotTables
–. Preparing data before building a PivotTable.
–. 2.2.3 A Simple Introduction to PivotTables
–. The basics of what PivotTables do.
–. 2.2.4 Calculated Fields in PivotTables
–. How to add calculated fields.
–. 2.2.5 Value-Show-As Options in PivotTables
–. How to change how values are displayed.
–. 2.2.6 Excel's Interaction Power Tool –. Slicers
–. Using slicers in PivotTables
to boost report interactivity.
– 2.2.7 PivotTable Field Grouping
– How to group fields to simplify complex displays.
Through this series, students master Excel data analysis and automated reporting from basics to advanced, effectively raising professional skills in data processing and analysis.
Related Courses

WorkBuddy zero-basics hands-on training: even non-programmers can follow the manual steps, learn agents systematically by doing

Higgsfield cinematic animation course: one-stop creation platform, complete animation production-flow teaching

The same dance with 6 outfits switching in order: I turned an outfit-change video into a Skill
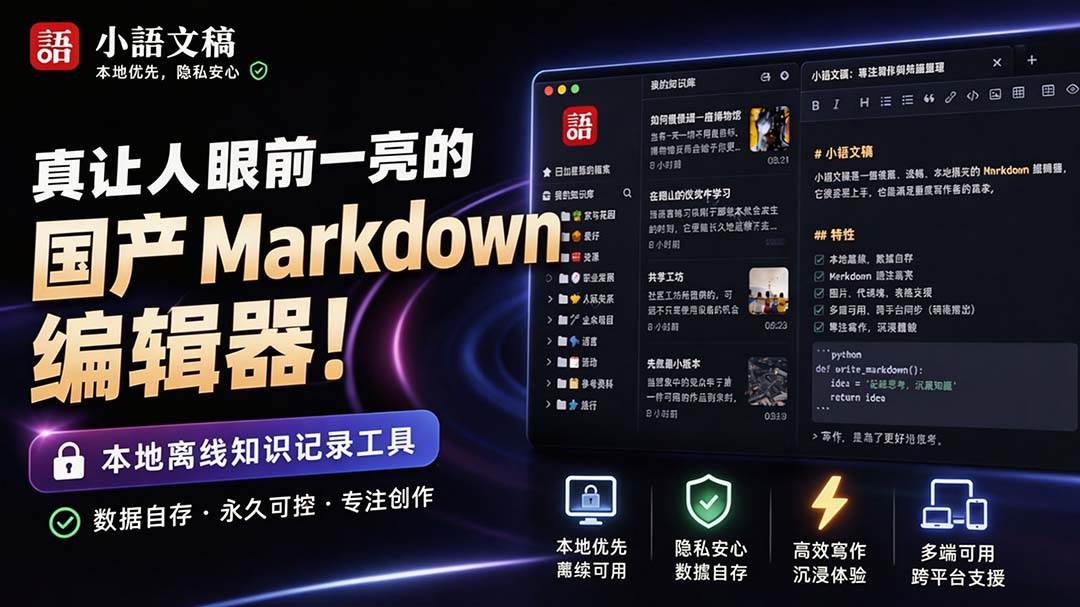
An eye-catching domestic Markdown editor: local offline high-performance note tool, free and no login required

Domestic Markdown editor: local offline high-performance knowledge-note tool, free and no login required

WorkBuddy practical blue paper: user manual and practice guide, complete combined image-text edition

Jimeng challenges a 180-second long video: one-click a 3-minute movie? Full production flow shared in detail

Super handy! Douyin video downloader, supports batch download of user works, favorites and likes lists, open-source free Better-douyin-R

Nearly 200K stars on GitHub - Harness now runs by double-click: the Harness full-platform desktop edition

Nearly 200K stars on GitHub - Harness now runs by double-click: the Harness full-platform desktop edition DSH Desktop